Feeding
Experimental protocol
Detailed procedures for preparing and recording images of Caenorhabditis elegans phenotypes can be found at the following links:
Configuration of the GUI
The Feeding analysis is implemented via a CellProfiler pipeline that uses a custom Worm Toolbox model. In Pipeline Selection, choose CellProfiler and select the Feeding pipeline.
Custom worm models
Performance of the pipeline will vary based on the magnification used to take the images. If you are interested in training your own Worm Toolbox model, please reach out to the wrmXpress developers.
Expected input
Feeding data may be analyzed in the form of individual TIF images per frame (i.e., the TimePoint structure utilized by ImageXpress). See the Data Organization page for more details. In the case of individual TIF images per frame, the directory structure should look like this:
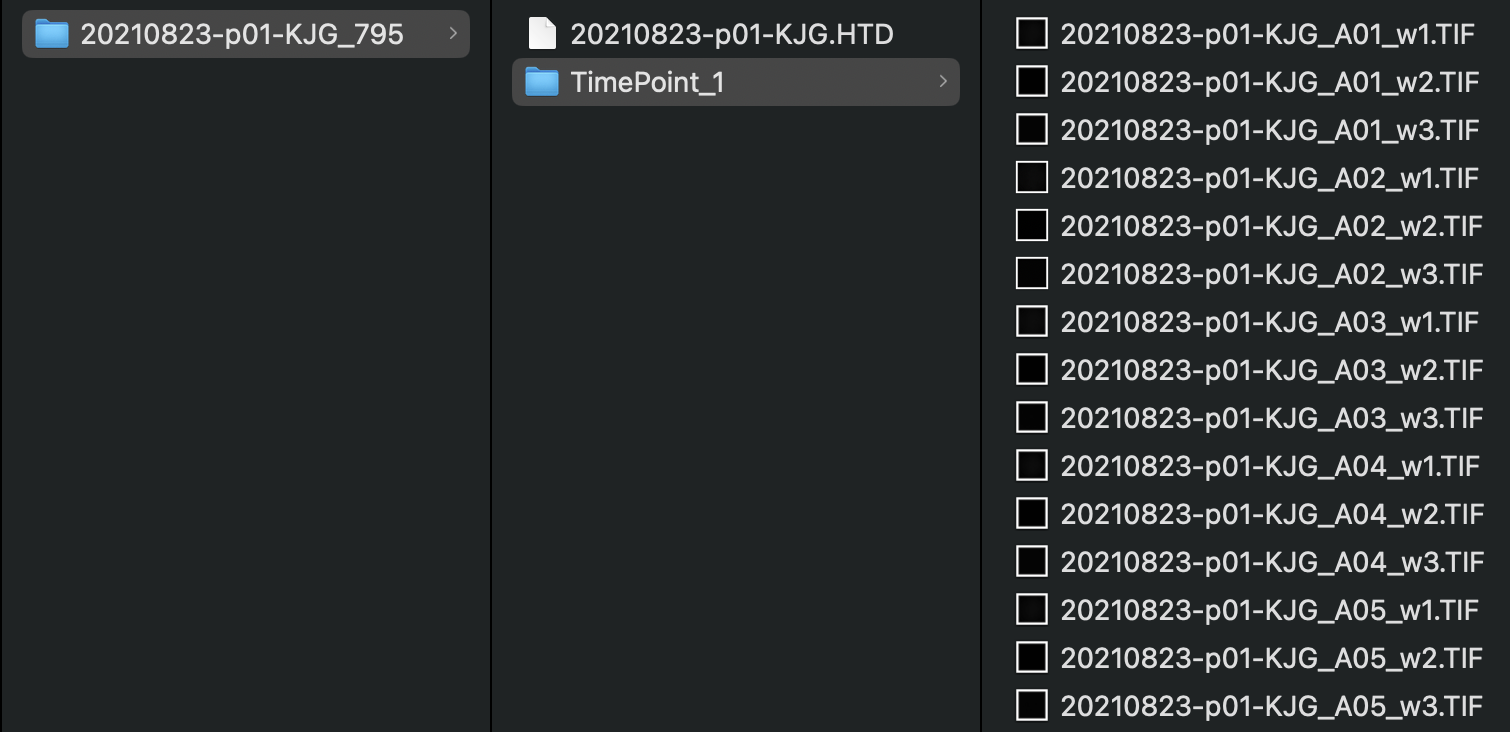
All experiments should include three wavelengths and single site.
Validated species and stages
- Caenorhabditis elegans young adults
Example plates
- 20210823-p01-KJG_795: Caenorhabditis elegans young adults
Expected output
A CSV file with at many columns of data generated by with CellProfiler's Worm Toolbox. If using Metadata, there will be an additional column for each provided metadata data frame.